Using Standard Topics
Standard topics are categories of information that are available by default once the SOTI XSight agent is installed. Use standard topics to monitor and analyze devices in Live View. Standard topics provide comprehensive insights into device performance, network conditions, and user behavior
Some of the standard topics that can be added to a view for monitoring and analysis include:
- CPU Usage
- Memory Usage
- Disk Space
-
Wi-Fi Signal
-
Cell Net Type
-
Network Switches
-
Hourly Drops
-
Battery Level
-
Device Temperature
-
App Usage
To add standard topics to a view:
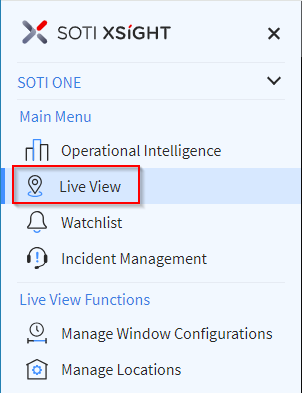
- From the main menu, select Live View.
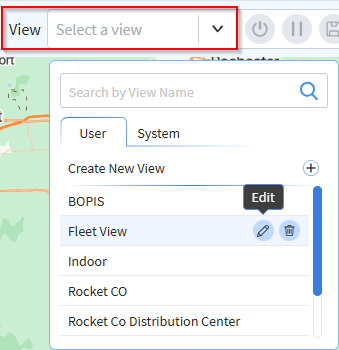
- From the View dropdown at the top of the screen, select
the Edit icon in the row corresponding to the view you
want to add topics to.
-
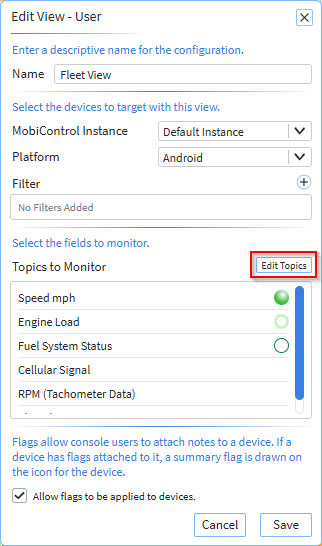
The Edit View - User panel displays. Select the Edit Topics button.
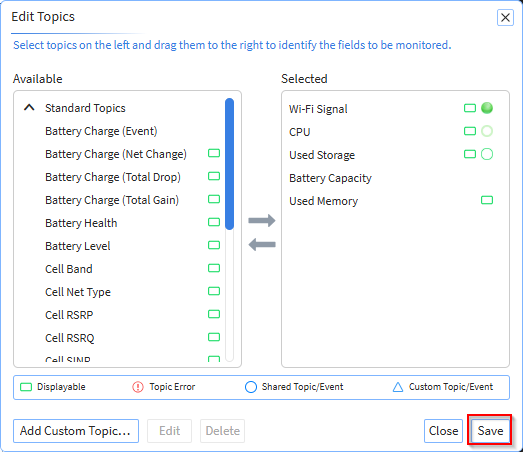
- The Edit Topics panel displays.
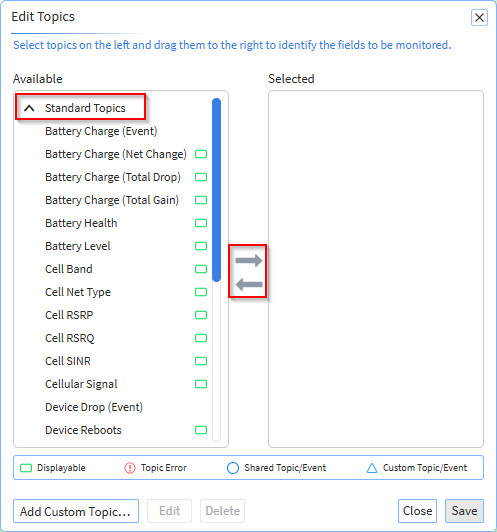
- Select Standard Topics from the
Available column to display the available standard
topics. The list of available standard topics appears in the
Available column. Pick the standard topics to add to
the view by selecting them in the Available column, one at
a time, and clicking the right arrow. This moves the chosen topic to the
Selected column. You can remove standard topics from
the view by highlighting the topic in the Selected column,
one at a time, and clicking the left arrow. This moves the chosen topic to the
Available column.
-
When you have chosen the topics to include in your view, select Save.


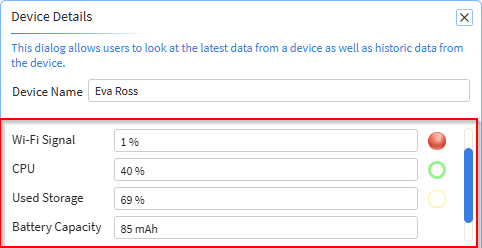
Alternatively, you can follow steps 1 through 3 above and then scroll through the topics in the Selected column to see the topics associated with the view. In either case, the selected topics are monitored on all device groups in the view.