Signal Strength Dashboard
The Signal Strength dashboard shows device signal strength per network carrier and type.
To open the Signal Strength dashboard, select Signal Strength from the dropdown menu.
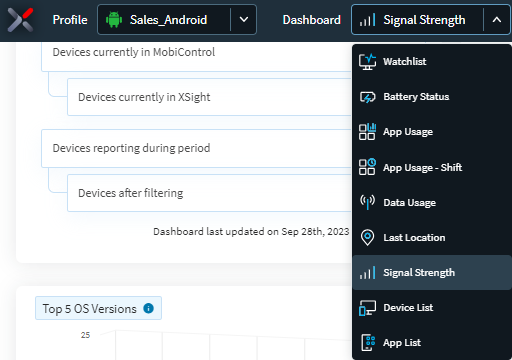
Select a time and date range from the menu to view signal strength. Select a pin to open the single device dashboard and view all devices associated with the pin.
Toggle Map Filters to alternate between an area heat map and selectable pins.
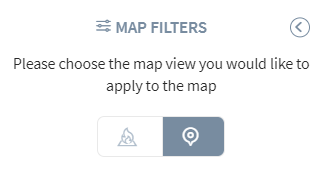
Connection Type
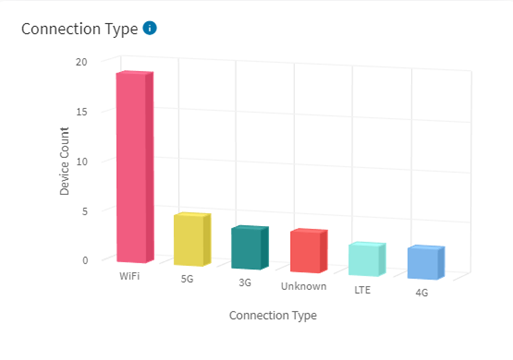
This chart shows a breakdown of signal strength based on different connection types of the devices.
How to use this chartUse this chart to identify signal strength based on whether the device connected via 5G, 4G, 3G, LTE or an unknown connection.
CalculationSOTI XSight identifies signal strength of device based on the medium the device connects to.
ConfigurationsDashboard users can change the data collection time. By default, the displayed data shows data collected at 8:00 AM. The user can change this time and view the data at different times of the day through the dropdown menu of the header.
Mobile Carriers
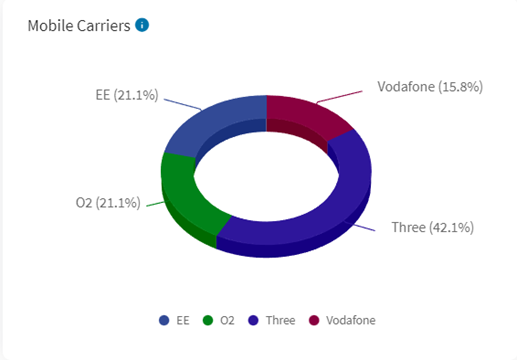
This chart shows a breakdown of devices based on mobile carriers used across devices.
How to use this chartUse this chart to identify signal strength of devices based on the mobile carrier of the device.
CalculationSOTI XSight identifies signal strength of devices based on the connected mobile carriers.
ConfigurationsDashboard users can change the data collection time. By default, the displayed data shows data collected at 8:00 AM. The user can change this time and view the data at different times of the day through the dropdown menu of the header.
Carrier Signal Strength
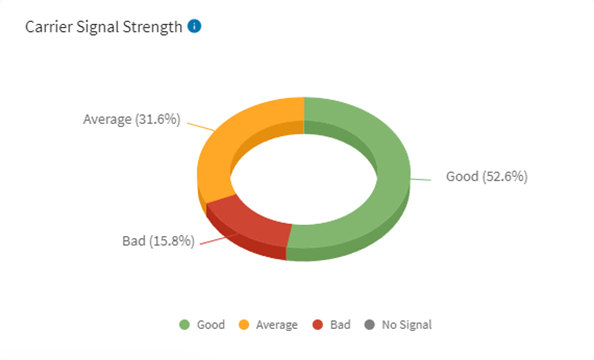
This chart shows a breakdown of signal strength of devices based on carrier signal strength.
How to use this chartUse this chart to identify signal strength of devices based on the mobile carrier of the device.
CalculationSOTI XSight identifies signal strength of devices based on the carrier signal strength of the devices.
ConfigurationsDashboard users can change the data collection time. By default, the displayed data shows data collected at 8:00 AM. The user can change this time and view the data at different times of the day through the dropdown menu of the header.