Charts Common to all Device Analysis Dashboards
This section contains information that applies to all device analysis dashboards.
Top X Manufacturers Chart
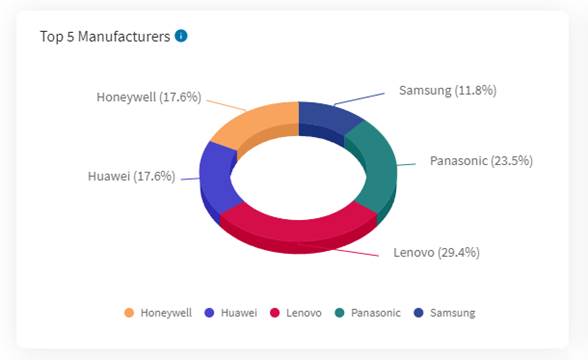
This chart shows the breakdown of manufacturers of devices that have reported data to SOTI XSight.
How to use this chartView the device battery health and performance for the dominant manufacturers in your device estate.
CalculationEach segment shows the percentage of devices by manufacturer based on the Top X manufacturers.
ConfigurationsDashboard users can change how many top manufacturers show on the chart. Changes to this dashboard are specific to the user and are not applied globally for all users.
Top X Models Chart
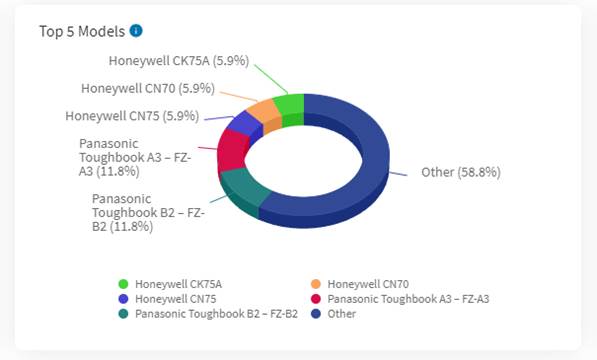
This chart shows the breakdown of models of devices that have reported data to SOTI XSight.
How to use this chartView the device battery health and performance for the dominant models in your device estate.
CalculationEach segment shows the percentage of devices by models based on the Top X models.
ConfigurationsDashboard users can change how many top models show on the chart. Changes to this dashboard are specific to the user and are not applied globally for all users.
Top X OS Versions Chart
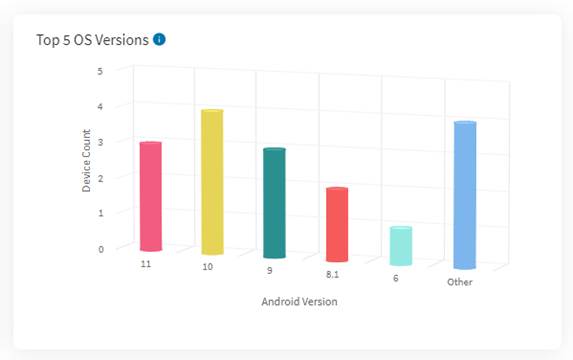
This chart shows the breakdown of OS versions of devices that have reported data to SOTI XSight.
How to use this chartView the device battery health and performance for the dominant Android OS versions in your device estate.
CalculationEach segment shows the percentage of devices by Android OS versions based on the Top X OS versions.
ConfigurationsDashboard users can change how many top Android OS versions to show on the chart. Changes to this dashboard are specific to the user and are not applied globally for all users.