App Usage Shift Dashboard
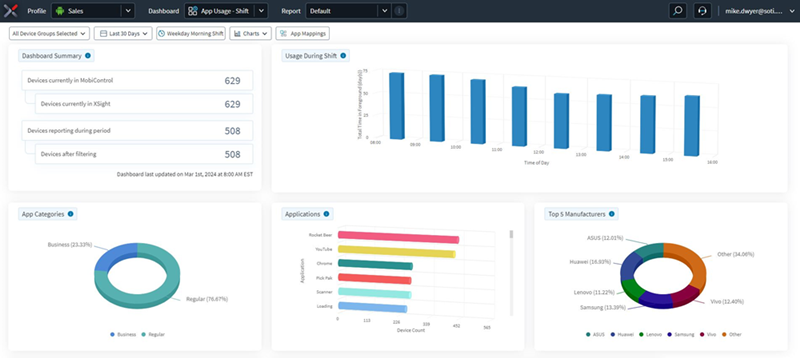
The App Usage - Shift dashboard displays information about installed applications, such as apps used during a shift and the top visited apps.
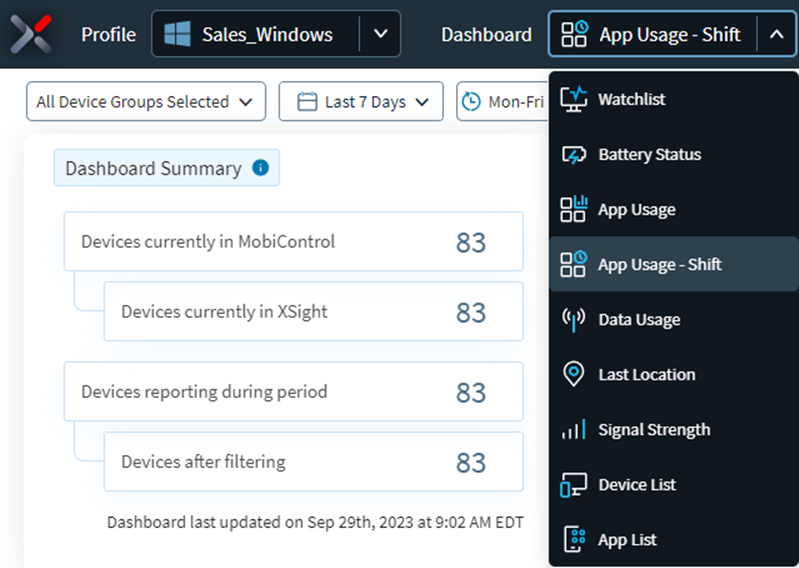
To open the App Usage - Shift dashboard, select , then select an analysis profile. Next, select App Usage - Shift from the dashboard dropdown menu.
Select a time and a shift from the header to view the app usage charts. Hover your mouse over data in a chart to see more detail. Select data in a chart to filter the other charts. The bottom of the dashboard lists all devices in the selected analysis profile. Selecting a segment or column in a chart refines the list. Selecting any of the devices in the list opens the Device Spotlight view. This view shows operational details of the selected device.
Usage During Shift
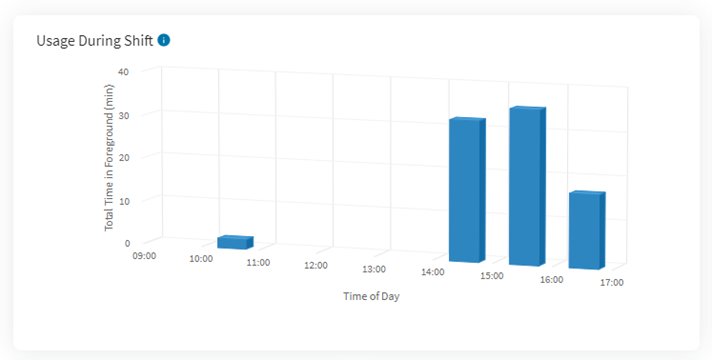
This chart shows applications categorized by the total duration of app usage on devices (usage in foreground) over the duration of the shift.
How to use this chartSelect a segment to see the total usage of all apps during that shift hour. If you select an app in the applications chart, data displays in conjunction with that chart.
CalculationSOTI XSight categorizes all apps usage based on the defined shift
The percentage of each category is the sum of all apps within the category divided by the total number of apps reported.
Applications
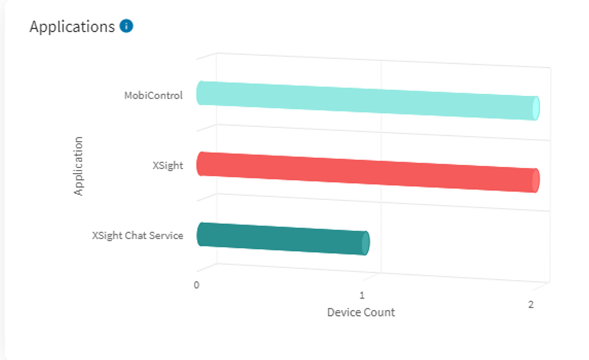
This chart shows applications categorized by the number of devices using the app over the duration of the shift.
How to use this chartSelect any application to see usage metrics change on other charts.
CalculationSOTI XSight aggregates all counts of the number of devices where each application was opened at least once during the shift.
App Categories
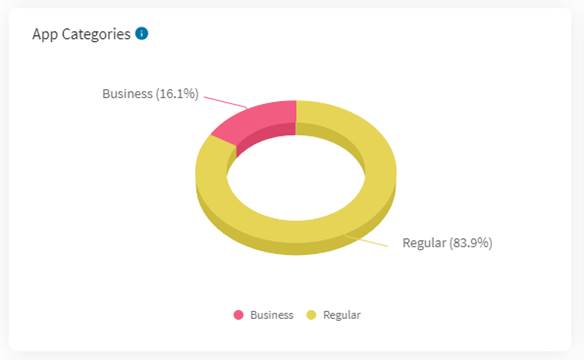
This chart shows the breakdown of apps by app category over the duration of the shift.
How to use this chartView app usage statistics with respect to a specific category of apps.
CalculationSOTI XSight categorizes all apps reported by the devices.
The percentage of each category is the sum of all apps within the category divided by the total number of apps reported.
ConfigurationsBy default, SSOTI XSight categorizes app as follows:
- System: Apps pre-loaded on the device that are not mapped to another app category, such as Business.
- Regular: Apps installed on the device after setup that are not mapped to another app category, such as Business.
- Business: common apps that SOTI customers use for business purposes.
By default, only Regular and Business apps are reported by the device to SOTI XSight. System apps are never sent to SOTI XSight unless designated to be sent within SOTI XSight’s App Mapping configuration.
SOTI XSight customers can create their own app categories and indicate whether apps should be sent by the device to SOTI XSight using the App Mapping configuration. The App Mapping configuration is accessible via the SOTI XSight Administration Utility.
Top X Visited Apps
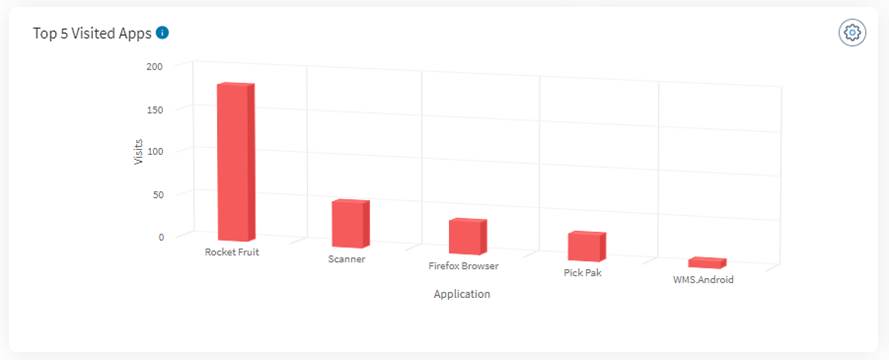
This chart shows top apps based on the number of times the apps have been opened and appeared in the foreground of the device over the duration of the shift.
How to use this chartApps with many visits indicate that the apps are actively used by device users.
CalculationSOTI XSight considers a visit as every instance when the app has appeared in the foreground; this can occur when the user taps on the app to open it or when the device is unlocked, and the app appears in the foreground.
SOTI XSight sums all visits for apps and displays the Top X apps by visits.
ConfigurationsDashboard users can change how many top Android apps based on visits display on the chart. Changes to this dashboard are specific the user, and are not applied globally for all users.
Top X Apps in Foreground Usage (Total)
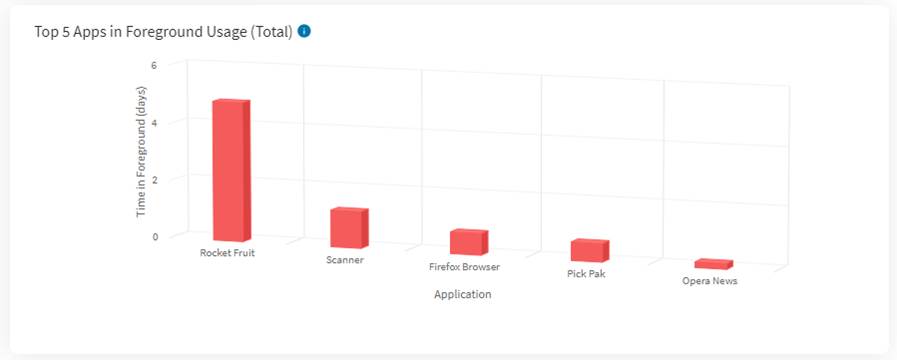
This chart shows top apps based on the amount of time the apps appeared in the foreground of the device.
How to use this chartUse this chart to determine when apps are actively used by device users.
CalculationSOTI XSight counts the amount of time an app appears in the foreground. Time when the device screen is locked or not on are excluded.
SOTI XSight sums the total foreground time for apps and displays the Top X apps by foreground usage.
ConfigurationsDashboard users can change how many top Android apps based on foreground time display on the chart. Changes to this dashboard are specific to the user, and are not applied globally for all users.