App Usage Dashboard
The App Usage dashboard displays information about the type of apps installed on devices and related usage data.
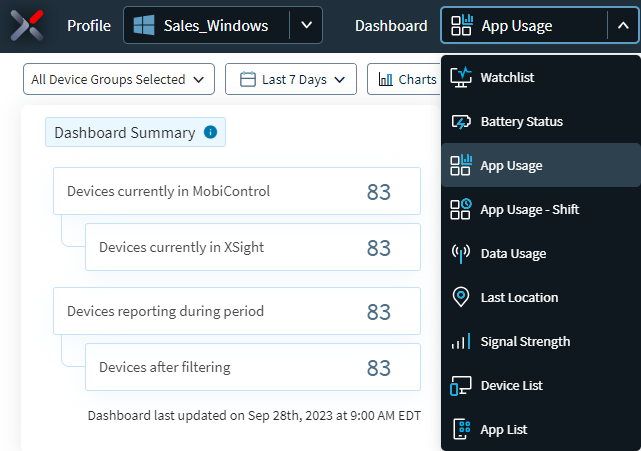
To open the App Usage dashboard, select ![]() SOTI XSight
. Select App Usage from the dashboard list.
SOTI XSight
. Select App Usage from the dashboard list.
Use the charts on the App Usage dashboard to view information such as top visited apps,
top trending installs, and app storage sizes. The bottom of the dashboard lists all
devices in the selected analysis profile. Selecting a chart segment or column refines
the list. Selecting any of the listed devices opens the Device Spotlight view, showing
the operational details of the selected device. 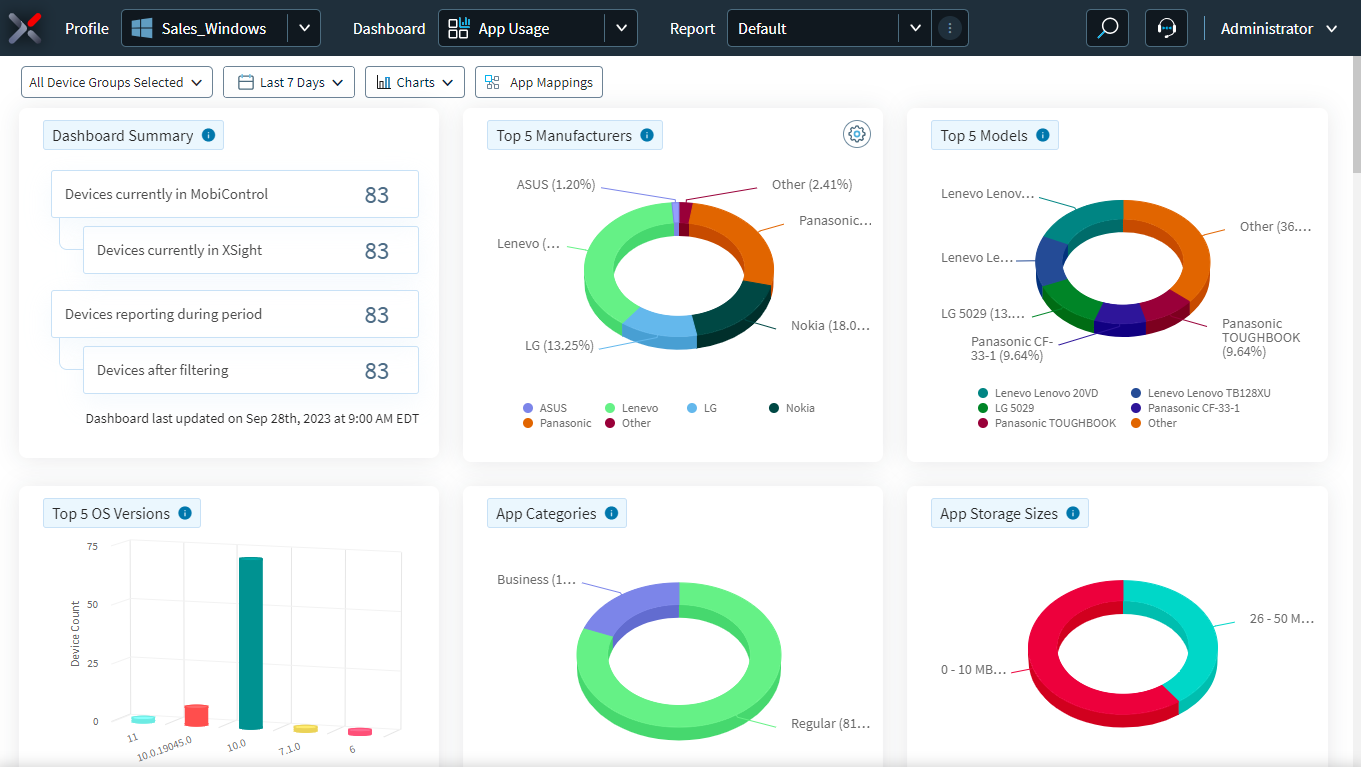
App Categories
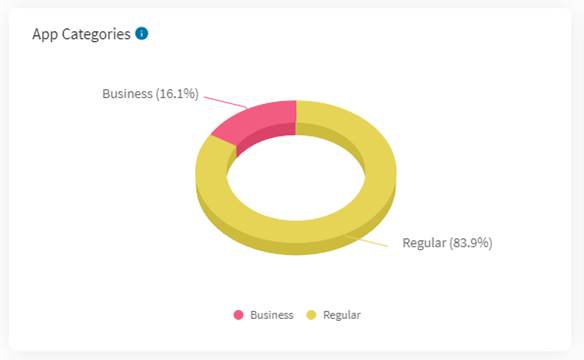
This chart shows the breakdown of apps by app category.
How to use this chartView app usage statistics with respect to a specific category of apps.
CalculationSOTI XSight categorizes all apps reported by the devices.
The percentage of each category is the sum of all apps within the category divided by the total number of apps reported.
ConfigurationsBy default, SOTI XSight categorizes apps as follows:
- System: Apps that are pre-loaded on the device that are not mapped to another app category, such as Business.
- Regular: Apps installed on the device after setup that are not mapped to another app category, such as Business.
- Business: Common apps that SOTI customers use for business purposes.
By default, the device reports only Regular and Business apps to SOTI XSight. System apps are never sent to SOTI XSight unless designated to in the SOTI XSight’s App Mapping configuration.
SOTI XSight Customers have the ability to create their own app categories and specify whether the device should send apps to SOTI XSight using the App Mapping configuration. You can access the App Mapping configuration in the SOTI XSight Administration Utility.
App Storage Sizes
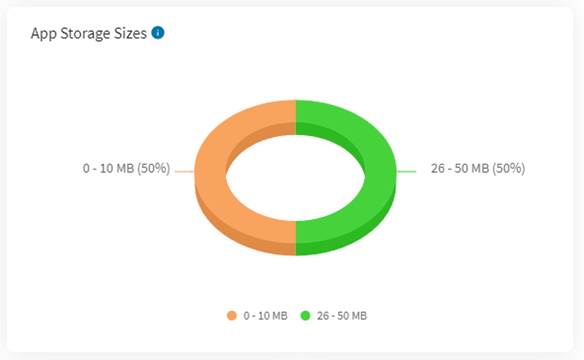
This chart shows the breakdown of apps by how much storage the apps take up on the device.
How to use this chartView which apps are consuming the most storage. This can help if there are devices that are low on storage. Once you identify apps with large storage footprints, use remote-control or scripting to clear the storage from the apps to free up space on the device.
CalculationSOTI XSight uses the last app size reported by apps within the date range specified in the dashboard.
SOTI XSight categorizes apps by the following storage sizes:
- 0 to 10 MB.
- 11 to 25 MB.
- 26 to 50 MB.
- 51 to 100 MB.
- 101 to 200 MB.
- 201 or more MB
The percentage of each app storage size is the sum of all apps within the storage size range divided by the total number of apps reported.
Top X Visited Apps
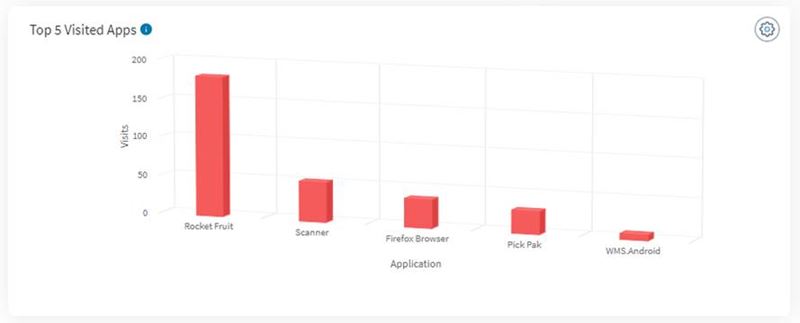
The chart shows the top apps that users have opened and that have appeared in the foreground of the device.
How to use this chartApps with many visits indicate that the apps are actively in use by device users.
CalculationSOTI XSight considers a visit as every time an app appears in the foreground. This can occur when the user taps on the app to open it or when unlocking a device and the app appears in the foreground.
SOTI XSight sums all visits for apps and displays the Top X apps by visits.
ConfigurationsDashboard users can change how many top Android apps based on visits show on the chart. Changes to this dashboard are specific the user, and are not applied globally for all users.
Top X Apps in Foreground Usage (Total)
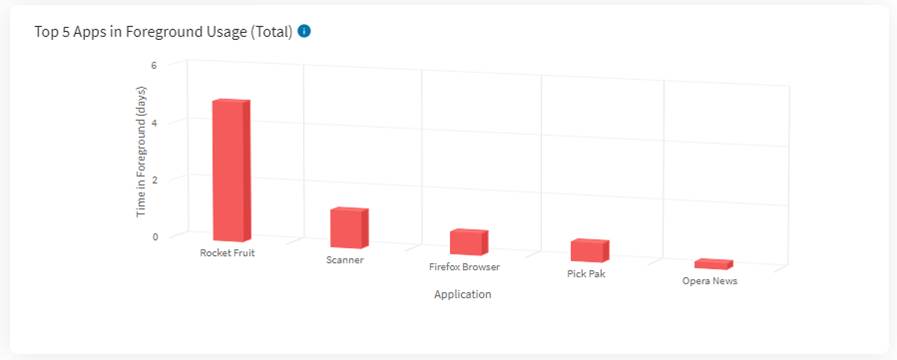
This chart shows top apps based on the amount of time the apps appeared in the foreground of the device.
How to use this chartUse this chart to view when apps are actively used by device users.
CalculationSOTI XSight counts the amount of time when an app appeared in the foreground. The amount of time when the device screen was locked or not on is excluded.
SOTI XSight sums the total foreground time for apps and displays the Top X apps by foreground usage.
ConfigurationsDashboard users can change how many top Android apps based on foreground time are shown on the chart. Changes to this dashboard are specific the user, and are not applied globally for all users.
Top X Trending Installs
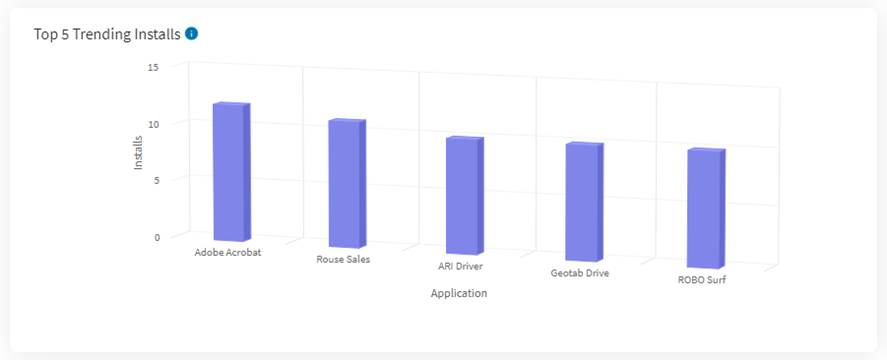
This chart shows top apps based on the number of times the apps have been installed on devices.
How to use this chartUse this chart to determine whether there are unapproved apps being installed by end users and set policies in SOTI MobiControl to blacklist/whitelist the apps.
CalculationSOTI XSight counts the number of times apps are installed or re-installed and displays the Top X apps by installation. App upgrades are not included in the installation count.
ConfigurationsDashboard users can change how many top Android apps based on installations displays on the chart. Changes to this dashboard are specific to the user and are not applied globally for all users.
Top X Apps Unopened
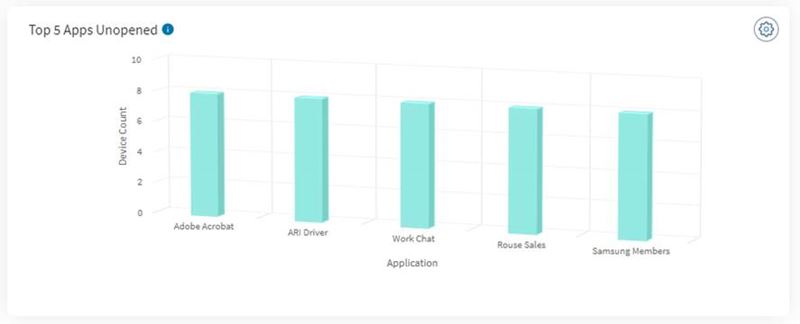
This chart shows top apps based on the number of times the apps were installed on devices but have not been opened (that is, not used).
How to use this chartLack of usage of certain apps may be due to app issues or poor adoption of the apps. Use this chart to identify unused apps and to identify why those apps are not used.
CalculationSOTI XSight identifies which apps are not used on one/more devices, counts the number of devices where the app was not used and displays the Top X apps by the number of devices that didn’t detect app usage.
ConfigurationsDashboard users can change how many top Android apps based on lack of usage on devices display on the chart. Changes to this dashboard are specific to the user and are not applied globally for all users.
Top X App Versions
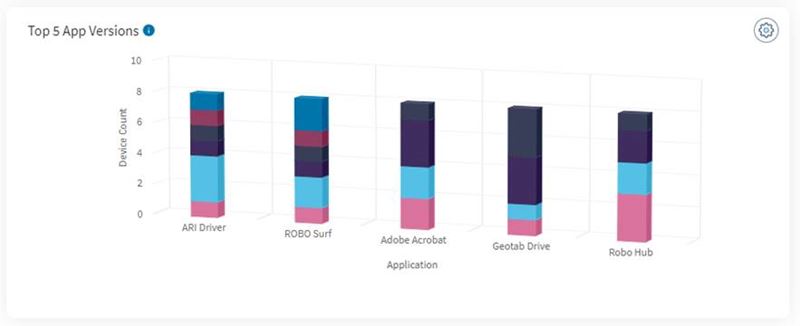
This chart shows a breakdown of versions for the top apps based on the number of times the apps have been installed on devices.
How to use this chartUse this chart to identify different apps’ versions installed on the device
CalculationSOTI XSight identifies which apps have their latest version installed opened on one/more devices based on the date.
ConfigurationsDashboard users can change how many top Android apps based on lack of usage on devices displays on the chart. Changes to this dashboard are specific to the user and are not applied globally for all users.