Device Analysis Dashboards
The Operational Intelligence dashboards are your key source for viewing, compiling and analyzing the condition of your mobile fleet. Out-of-the-box dashboards for battery status, app usage, data usage, location, signal strength and app spotlight help you analyze critical device functionality. You can customize dashboards to show only relevant metrics, and you can filter results by device group, date range and dashboard type.
- The dashboard’s Device Analysis Profile targets the device’s SOTI MobiControl device group.
- The device has reported device battery data back to SOTI XSight.Note: You specify the device’s data submission interval within the Device Analysis Profile.
- The device meets the dashboard’s device group selection and search criteria, and has submitted data within the specified date range in the dashboard
You can access the dashboards from a dropdown menu on the Operational Intelligence view.
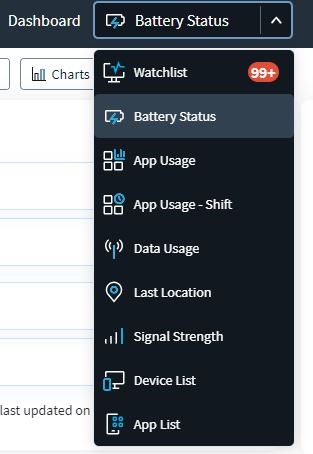
Dashboards consist of three sections. The top section is for filtering the displayed results. The middle section shows graphical representations of various device statistics. The charts change depending on the selected dashboard, and you can add or remove charts from the display. The bottom of the dashboard lists all devices in the selected analysis profile. Selecting a segment or column in a chart refines the list, and selecting any of the devices in the list opens the Device Spotlight view. This view shows operational details of the selected device.
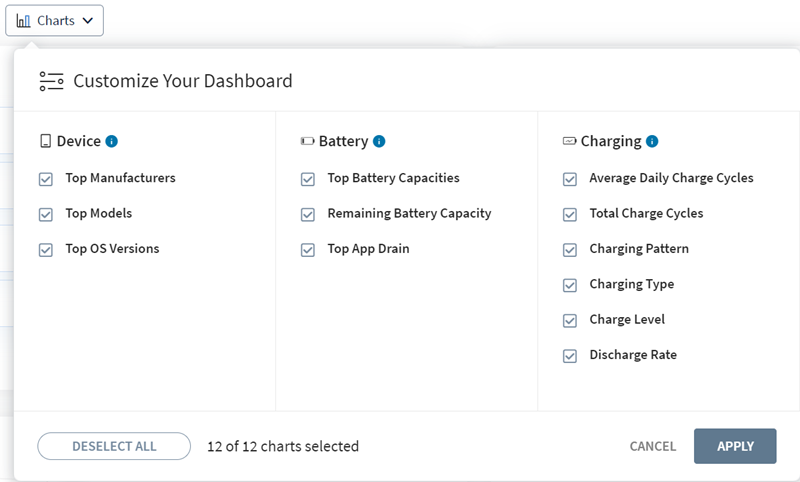
Customizing Dashboards
You can choose which charts to display on each dashboard using the add/remove charts dropdown. The checkbox next to a chart type toggles whether to display that chart type, so that your dashboards show only the relevant information.