


Seeing is believing. Especially the status of your mobile and industrial printers.
You can’t know what’s happening with printers when they’re scattered throughout warehouses, trucks and distribution centers. Unless you visit each one, which is impractical and impossible.
But printers can’t be ignored, either.
SOTI Connect delivers total visibility of your printers. It has three key visualization capabilities letting you “see” what’s happening with your mobile and industrial printers. All without the time, expense and hassle of having to physically visit them. They are:
-
Dashboard for printer management.
-
Device information page.
-
Visual board.
Let’s take a look.
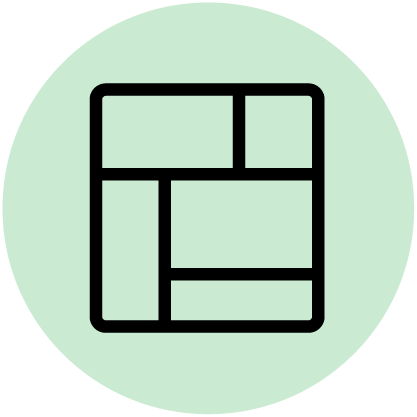
1. Dashboard for Printer Management: View All Devices at Once
Printers are everywhere. You simply can’t physically check on all warehouse printers on Monday and all mobile printers on trucks on Tuesday and so on.
The solution is to group printers by location, function or whatever criteria you choose. View devices within a device group at once, or use search criteria to look up specific properties and their status within that group, such as:
-
Wi-Fi status
-
Battery state of charge
-
Device state

There are numerous properties accessible from the dashboard. Bright charts provide additional visualization of the status of all devices within a group.
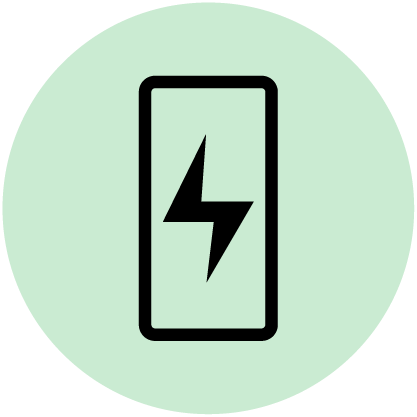
2. Device Information Page: Everything You Need to Know about a Single Device
Unsure when a printer last checked-in or was updated? The Device Information Page has date-driven data on things like firmware, state history and uptime. Know how the printer arrived at its current state without digging through files and code.
Tabs atop of the Device Information Page displays more information. Key tabs include:
-
Rules: View rules applied to the printer. Rules include action rules to perform actions at periodic intervals and compliance rules define criteria to ensure compliance.
-
SOTI XSight: Manage incidents in SOTI XSight, the Diagnostic Intelligence solution. Integrating SOTI Connect with SOTI XSight allows for faster incident management and reduced downtime.

Everything about a printer is here. Battery serial number. Certificate history. System logs. If you need to know what happened – and when – the Device Information Page is the place to go.
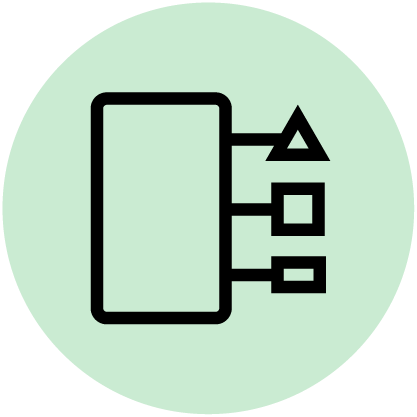
3. Visual Board: View Specific Info and Take Actions on a Single Screen
In healthcare, proper darkness levels ensure text on patient wristbands are easily read. In transportation and logistics (T&L), print speed matters. Specific printer metrics which are critical to business operations must always be present, along with actions to mitigate issues.
The Visual Board lets you select and display relevant data at-a-glance. Then, select specific actions like checking-in or printing test pages. Surface the essential information you need to know and view it through charts, graphs or gauges. You choose.
Building a Visual Board occurs in the SOTI Connect Visualization Studio. Drag-and-drop various widgets onto your board.

The widgets are:
Organize: Select how many widgets you need and their placement.
Actions: Perform actions, such as applying configurations or moving printers between groups.
Properties: View properties including serial numbers or active IP address.

Images: Upload images to your dashboard. See the printer’s appearance as you view its data.

Charts: Add line charts, bar charts or donut charts to your board.

Gauges: Add circular or bar gauges for easy presentation of data.
How They Work Together
-
Visit the Dashboard for an overview of all printers within one group or many groups. You notice there’s a printer with a yellow device state, signifying a potential issue. The Dashboard also shows green (printer is performing normally) and red (urgent issue that needs immediate attention) device states.
-
Click the printer with the yellow device state to reach the Device Information Page. Every detail of that printer is there.
-
Click the Visualization tab at the top of the Device Information Page. Arrive at the Visual Board you built with the charts and gauges you chose to display critical printer values you selected. Quickly identify the problem, and, from the same page, resolve it before it becomes critical.
The experience is linear and intuitive. The Dashboard shows all printers. The Device Information Page tells you everything about a specific printer. Your Visual Board displays only the details and actions that matter to your business-critical printing operations.
Total Visibility Means Total Control
Visualization in SOTI Connect shows you what’s happening with your printers.
The printer management Dashboard provides at-a-glance insights into printers within groups. The Device Information Page displays everything about individual printers. Visual Boards let you build customized boards with info and actions essential to your business operations.
These three visualization features let you see what’s happening with your printers without being in front of them. Know if printers are performing properly, have a potential problem, or have an immediate issue.
See for yourself.