Adding a New View
This topic describes how to create a view to track parameters that you specify for a set of devices. You select which devices to track, the data items or topics to watch, and how the map displays that information.
About this task
Procedure
- Select Live View from the SOTI XSight main menu.
- Select Map or List from the Display dropdown menu.
-
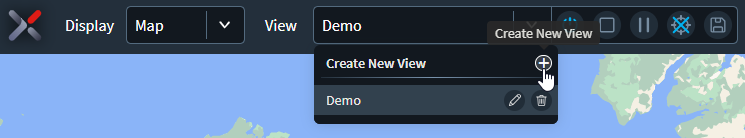
Open the View dropdown menu and select Create
New View. The Configure View panel
displays.
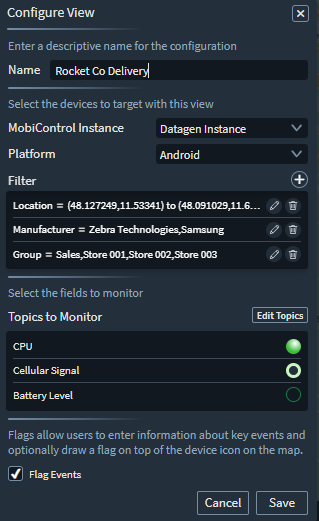
- In the Name field, enter a unique name to identify the new view.
- From the MobiControl Instance dropdown menu, select the instance of SOTI MobiControl you want the new view to use.
- From the Platform dropdown menu, select Android or Windows.
-
In the Filter section, select the Add button then any of
the following filters. Filters let you decide which devices display in the view.
You can add as many filters as you need.
Filter Description Device From the Configure Device Group menu, select the groups whose devices you want to add to the view. 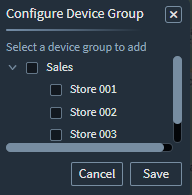
Location Grab and drag the map until you see the area you want the view to cover. Move and resize the red rectangle to select a specific area on the map. 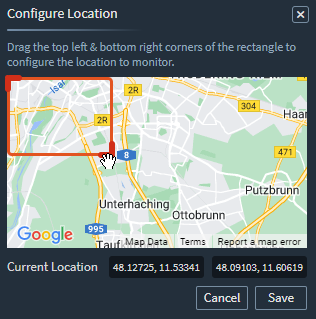
Manufacturer On the Configure Device Manufacturer panel, select the device manufacturers you want to add to the view. 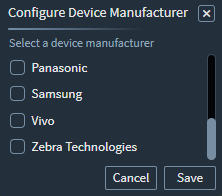
Device Name On the Configure Device Name panel, enter the name of a device you want to add to the live view. You can filter the search using the Equals, Starts With and Contains radio buttons. 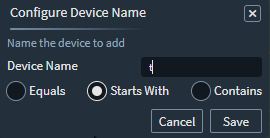
- Edit or delete a filter using the controls to the right of each filter.
-
Beside Topics to Monitor, select Edit
Topics. The Edit Topics panel
displays.

-
Select topics you want to add to the view from the
Available column and use the right-pointing arrow to
move them to the Selected column. You can also drag
topics between columns and up and down to change the order.
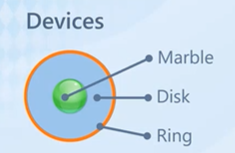
Note: The first three topics in the Selected list appear as a region of the device icon on the map so you can see their status at a glance. You can see all other added topics by scrolling, or by opening the List.Icons shown on Map and List mode indicate the state of an device. The circle icon represents a device. The inner circle, or marble, is the center. The thicker layer is the disk, and the outer layer is the ring. Each part has meaning as determined by you.You can edit the properties of the circles by highlighting a topic on the Selected list then choosing Edit. The Edit Topic panel displays.
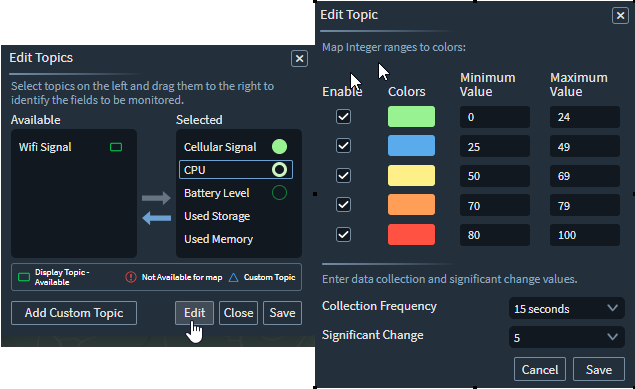
Assign meaning to each color by defining a range during which the color displays. In the following example, the topic represents the number of pallets of bottled water in a delivery truck.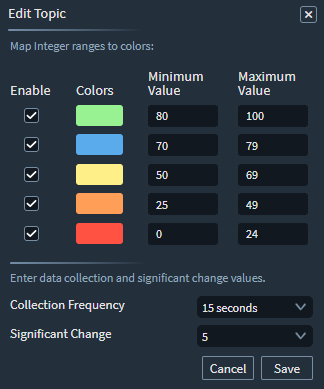
Assume that this topic is at the top of the list, represented on the map by the inner marble. The marble shows green when the truck has between 80 and 100 cases of water. When the stock drops to 70 cases, the marble turns blue. If the stock drops below 24 cases, the marble turns red.
Use the Collection Frequency dropdown list to set how often the device sends topic data. Select a value from the Significant Change dropdown to choose an amount of change that must happen before the device sends data. This prevents transmission of every small change, thereby saving unnecessary data usage. You can configure this setting so that expected fluctuation does not generate data. In the example, if the truck's stock of bottled water drops by five cases between collection frequencies, the device sends data.
- Select Add Custom Topic to pull data from third-party apps and display it in Live View. See Adding Custom Topics for details.
- Select Flag to give users the option to display information about key events for a device. See Adding a Flag to a Device for details.
- Select Save to finish setting up the view.