Analyzing Device Details
You can view details of a single device using the Device Details panel. This panel lets you see events for selected topics over a 72 hour period and drill down into the details.
To open the Device Details panel from the map, select a device.
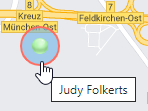

To open the Device Details panel from the list, select the Get
Details button beside a device on the list.

The following diagram describes the parts of the Device Details panel:
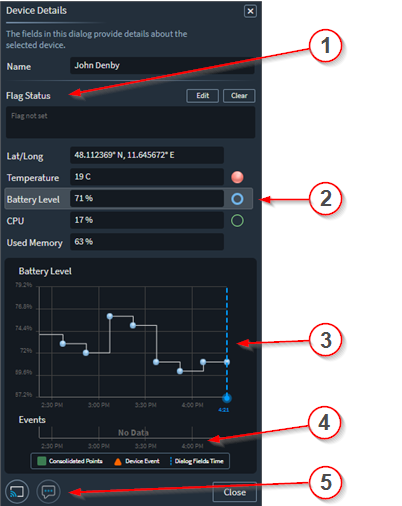

| Callout | Description |
|---|---|
| 1 | Use flags to assign special notes to a device and also to tell
users of important issues. Flags appear on the map beside the
device. 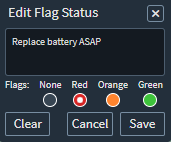 |
| 2 | See topics and their current values. |
| 3 | This section displays a graphical depiction of the topic selected
from the list. 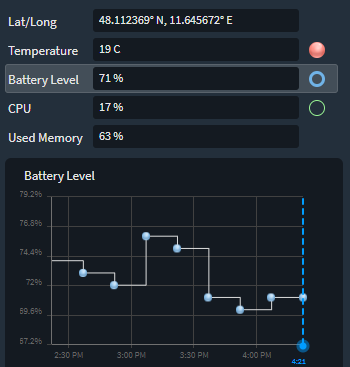 |
| 4 | The Event chart shows up to 72 hours of automatically generated
notifications of special events that may affect the operation of the
device. For example, device drops and excessive battery level drop
over a short period of time.  |
| 5 | Activate Remote Control and Live Support to interact directly with the device end user. |