Web App Usage
The Web App Usage dashboard displays information about the type of apps installed on devices and related usage data.
See the Device Analysis Dashboards Overview section for information on Accessing and Customizing a Device Analysis Dashboard.
To open the Web App Usage dashboard:
- Follow steps 1 through 4 in Accessing and Customizing a Device Analysis Dashboard.
- In the Dashboard dropdown, select .
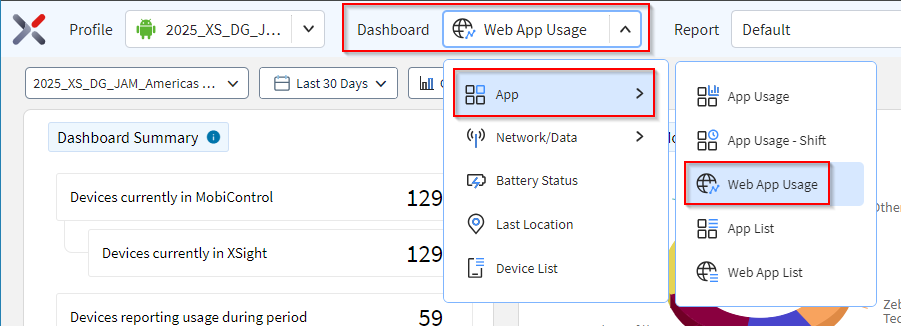
-
Hover over data in a chart to see more detail. Select data in a chart to filter the other charts. Selecting a segment or column in a chart refines the list.
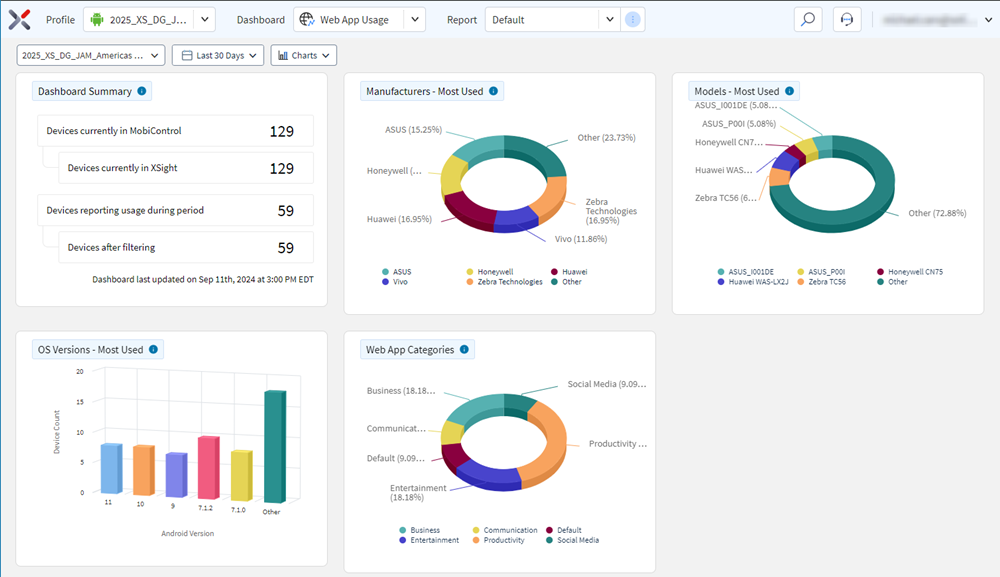 Note: The device list appears at the bottom of the dashboard.
- The device list lists all devices in the selected analysis profile.
- Selecting any of the devices in the list opens the Device Spotlight view.
- The Device Spotlight view shows operational details of the selected device.
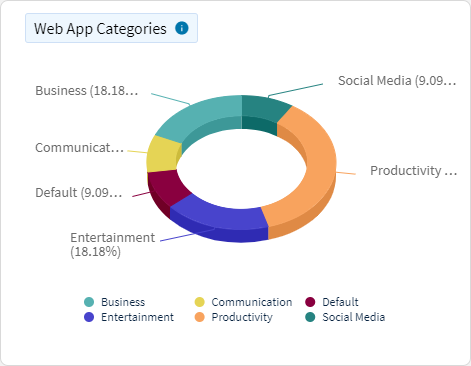
Web App Categories
This chart shows devices categorized by the number of web app categories they're reporting data for. Select a segment to analyze a device by web app category.
Top Visited Web Apps
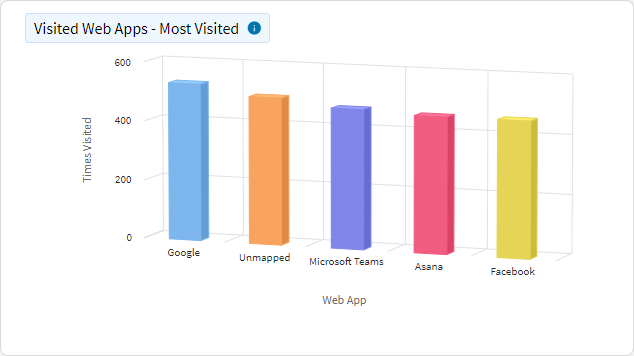
This chart shows the number of visits to each web app. Select a segment to further analyze the app.
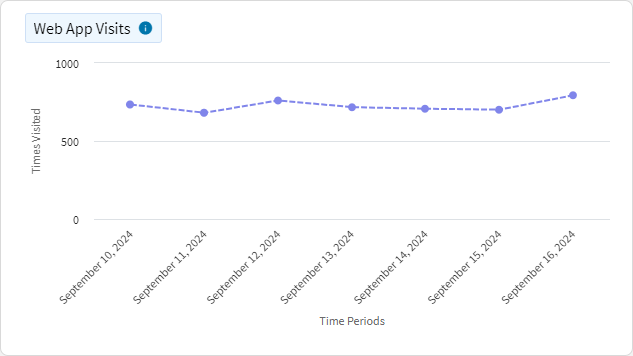
Web App Visits
This chart shows the number of visits to web apps per reporting period over a selected time.
Top Web Apps by Time in Foreground
Web App Foreground Time
This chart shows the amount of time a web app spent in the foreground per reporting period over a selected time.

Top Web Apps by Error
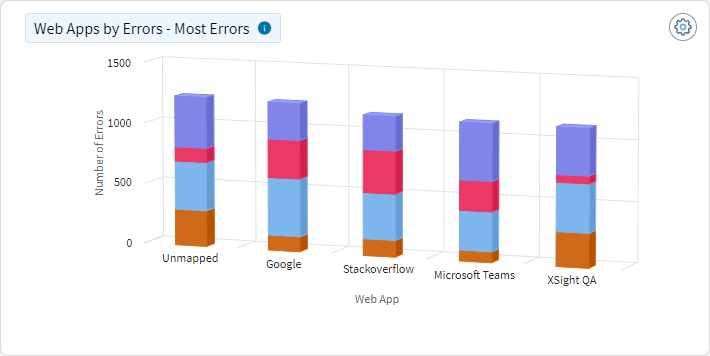
This chart shows the number of errors reported by each web app. Select a segment to further analyze data based on the error type.
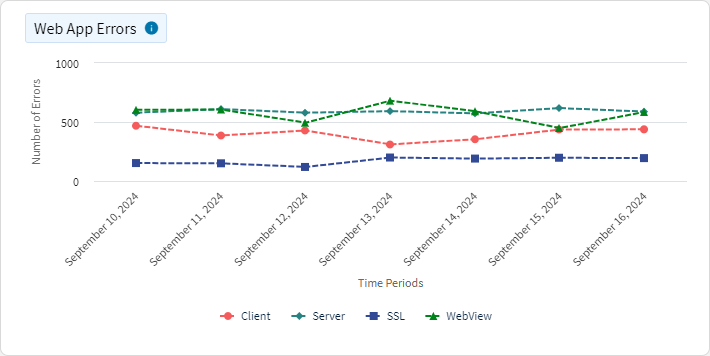
Web App API Error Codes
This chart shows the number of errors reported by web apps over a selected time.
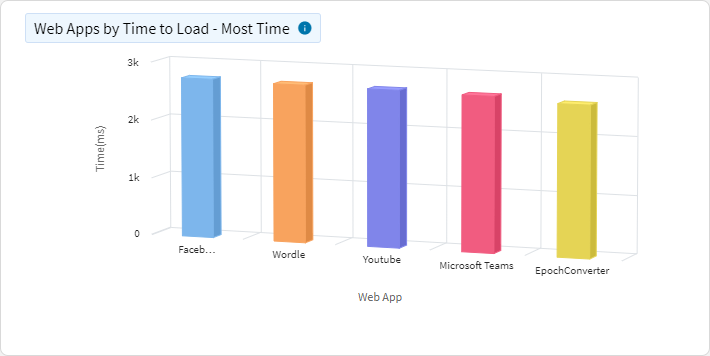
Top Web Apps by Time to Load
This chart shows the average time to load URLs for web apps. Select a segment to further analyze data based on time to load.
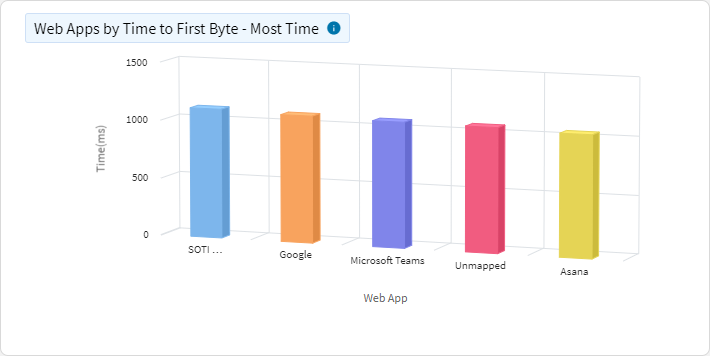
Top Web Apps by Time to First Byte
This chart shows the time to first byte by web app, averaged over each URL visited. Select a segment to further analyze data based on time to load.
