Analyzing Battery Status
The Battery Status dashboard provides insight into how selected devices utilize batteries and the conditions the batteries are used under. To analyze and predict the performance of smart batteries, see Analyzing Smart Battery Condition.
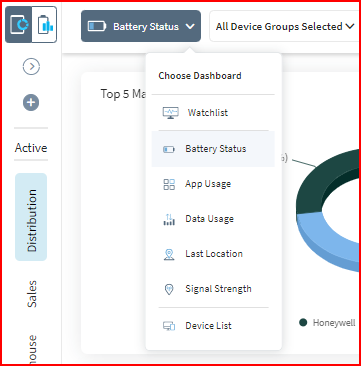
You can view the Battery Status dashboard by selecting it from the dashboard dropdown menu.
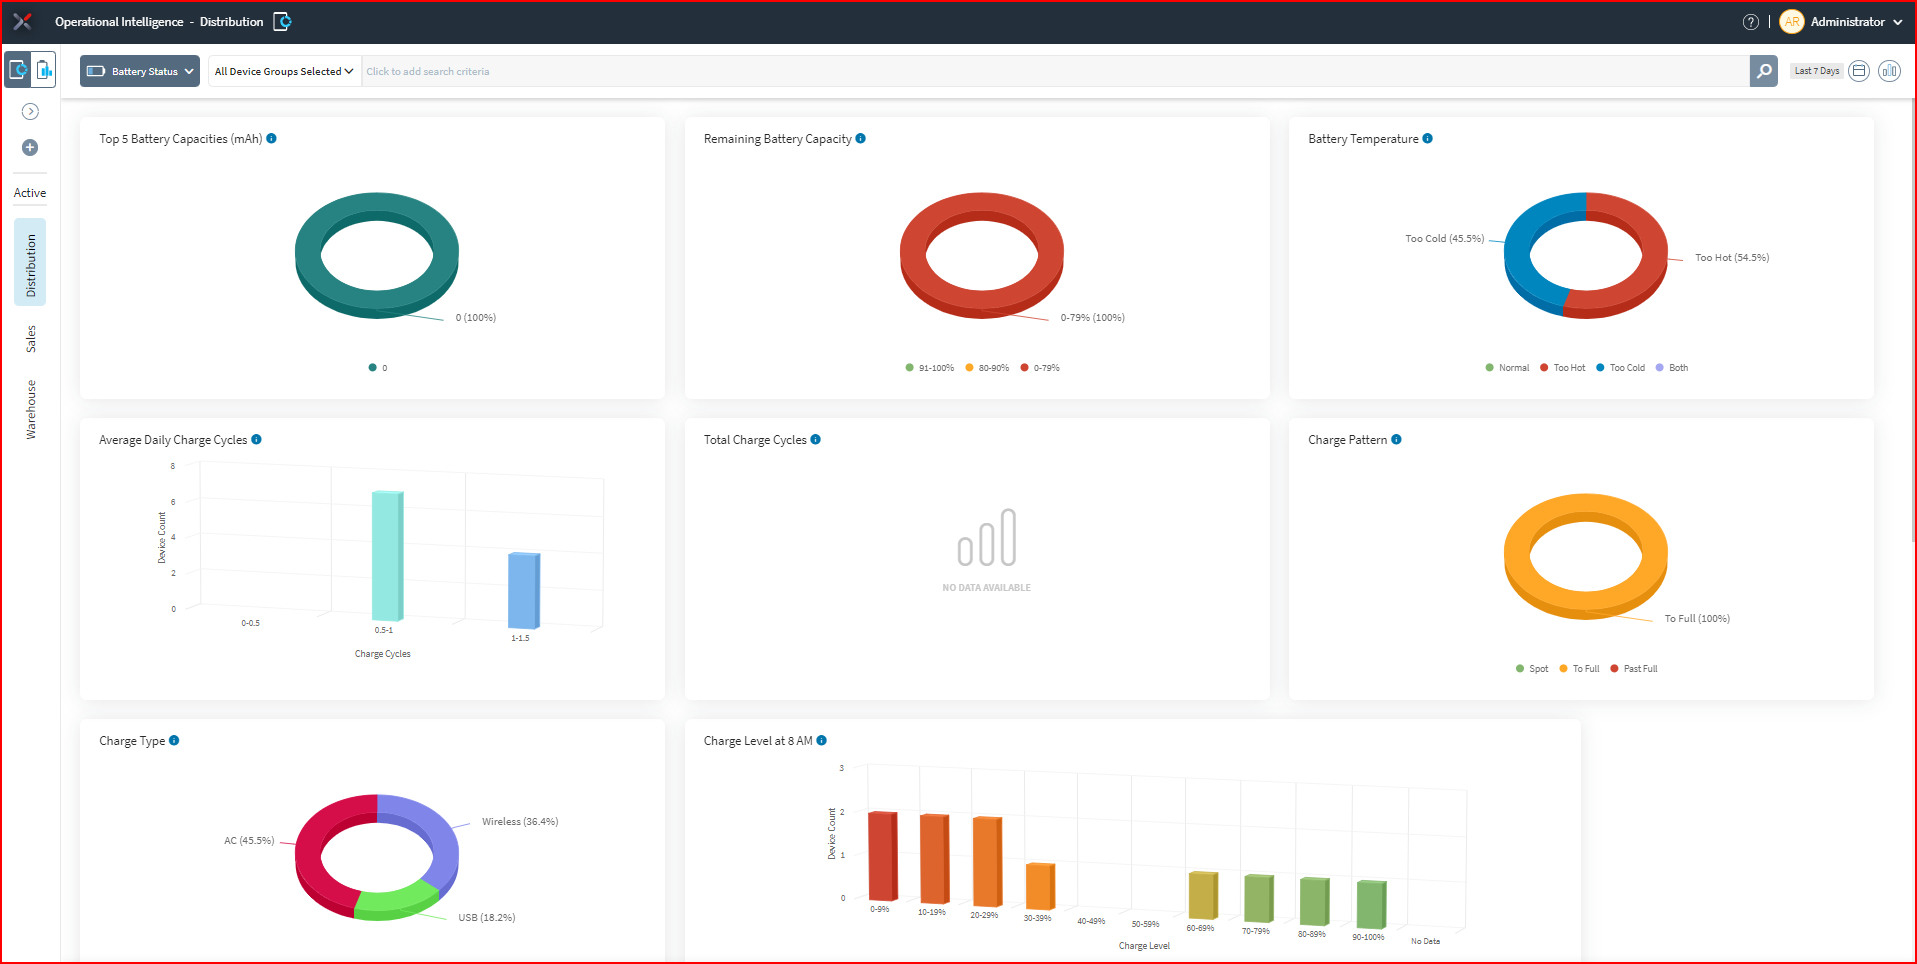
From the Battery Status dashboard, you can monitor how long batteries are charged, how quickly they are discharged, and which apps contribute to the drain.
You can customize this dashboard by adding or removing the available charts.
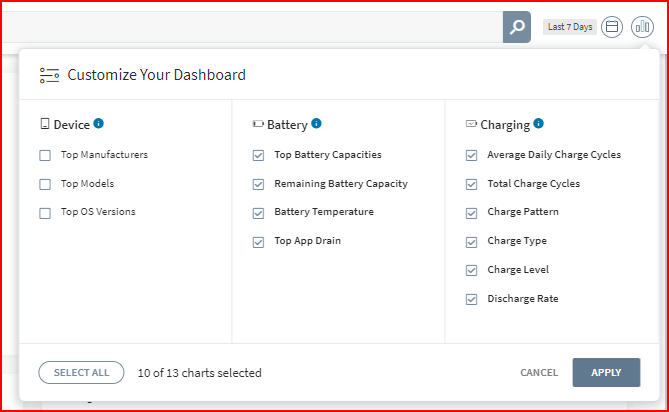
The table below lists and describes all of the available charts.
| Dashboard | Description |
|---|---|
| Top 5 Models | Devices categorized by model |
| Top 5 OS Versions | Devices categorized by operating systems |
| Top 5 Manufacturers | Devices categorized by manufacturer |
| Top 5 Battery Sizes | Devices categorized by battery size (mAh) |
| Remaining Battery Capacity | Categorizes devices by remaining charging capacity. Charge capacity is calculated as a percentage of remaining charging capacity of the battery compared to when the battery was new. Good – capacity over 75%, Average – capacity between 50-74%, Bad – capacity between 0-49% |
| Battery Temperature | Categorizes devices by average temperature during the selected time period.
|
| Average Daily Charge Cycles |
Average daily charge cycles of a battery within the specified date range |
| Total Charge Cycles |
Total number of charge cycles a battery has undergone. A charge cycle is equivalent to the battery being drained to 0% and then being fully discharged |
| Charging Pattern | Categorizes devices by the pattern most commonly used to charge them.
|
| Charge Type | Categorized by type of charging equipment employed |
| Charge Level at a selected time | Categorized by battery charge percentage at the selected time |
| Discharge Rate | Number of devices grouped by discharge rate percentage |
| Top 5 App Drain (Foreground) | Categorized by applications causing battery drain |