Personal Shopper Utilization
SOTI XSight Personal Shopper Utilization provides insight into the life cycle of each Personal Shopper device. Personal Shopper Utilization receives data from the SOTI Personal Shopper Application and provides the data needed to reduce idle time, streamline device circulation, and monitor usage trends, maximizing the value of your Personal Shopper devices.
The Personal Shopper Utilization feature handles data for stores with Entrance and Exit walls and for stores with only Entrance walls. Refer to the requirements below for each scenario.
Requirements
- SOTI XSight 2025.1.0
- Device Models: Zebra Personal Shopper devices (PS20, PS20 Plus, PS30, PS30 Plus)
- Application for Personal Shopper devices: SOTI Personal Shopper Application
- Third-party Store App integration (only in the case of no Exit walls): SOTI XT Sock Personal Shopper Plugin
Configuring Personal Shopper Utilization Profile
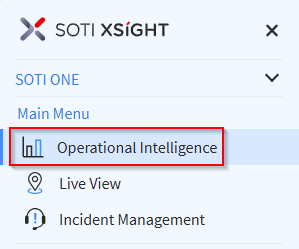
- Select Operational Intelligence from the main
menu.
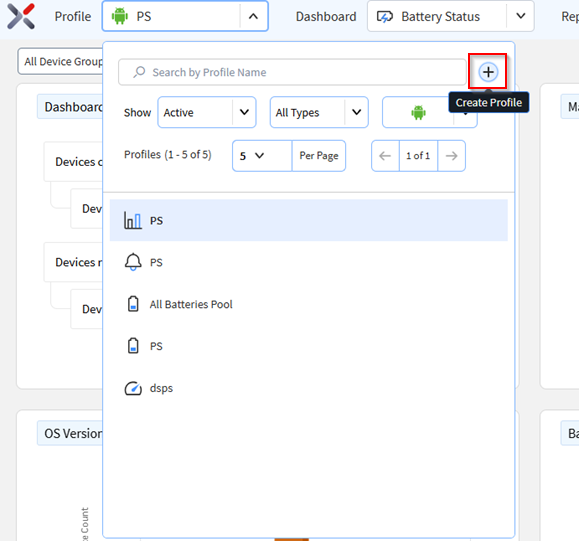
- Select Create Profile from Profile dropdown.
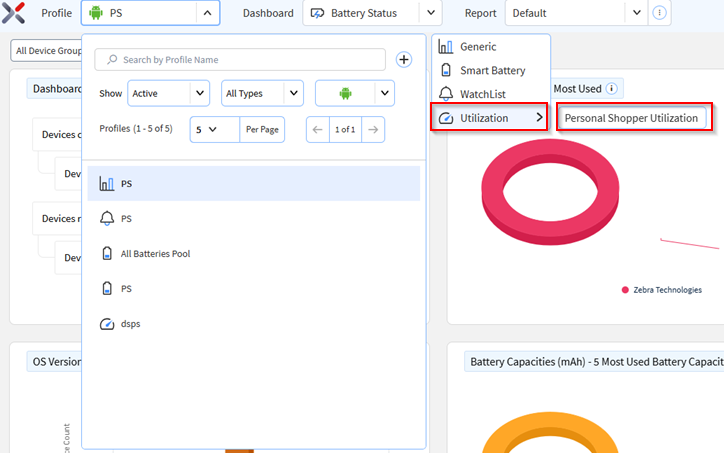
- Select .
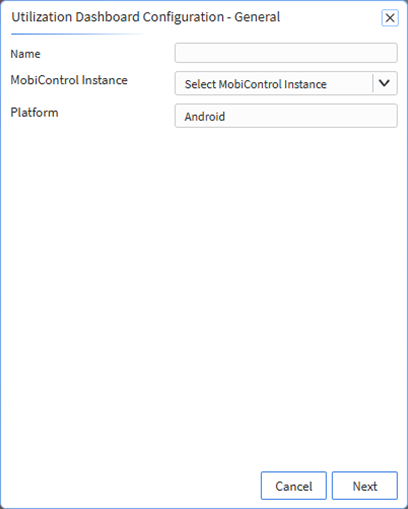
- Enter a descriptive name for the profile and select a SOTI MobiControl instance. Select
Next.
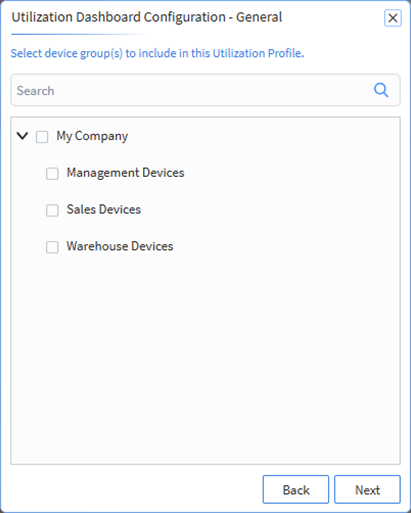
- Choose one or more device groups. Select Next.
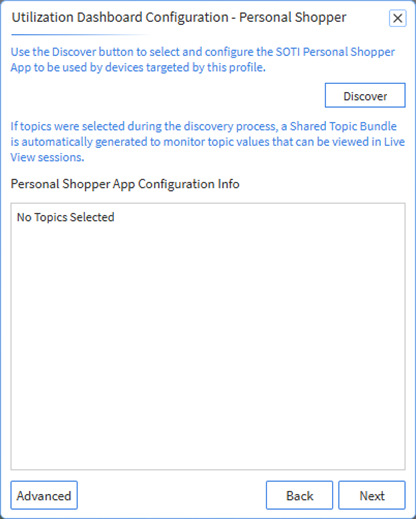
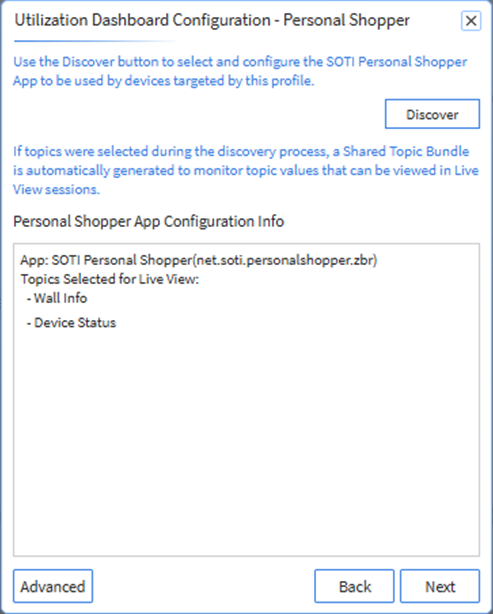
- Select Discover to add the SOTI
Personal Shopper Application and to optionally add topics to monitor in Live
View.
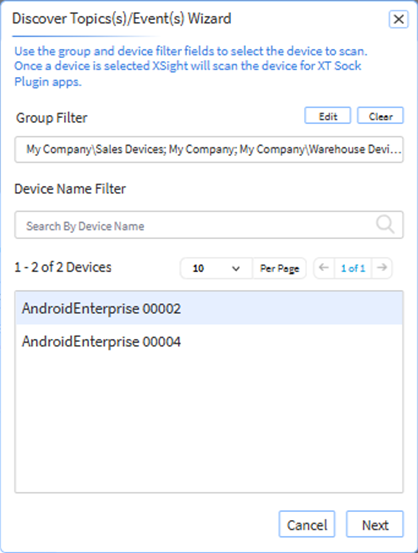
- Select a device with the SOTI Personal Shopper
application.
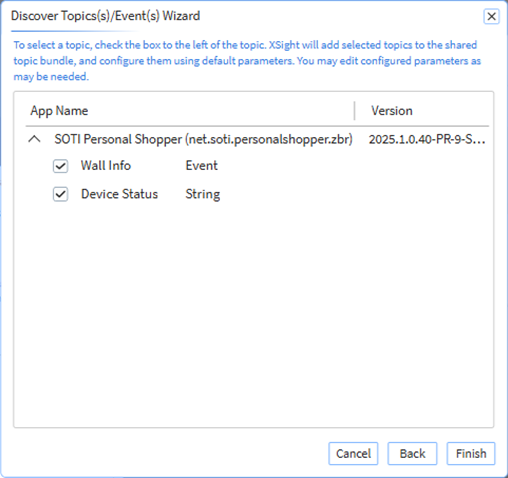
- Optionally select available topics from the SOTI
Personal Shopper Application and select Finish. Note: These topics are available as Shared Topics to select while configuring a view with Personal Shopper devices in Live View and Watchlist.
- Select Next after configuring all the topics to
monitor. The Personal Shopper Topics can be selected as Shared Topics to
monitor in Live View and Watchlist (see the Personal
Shopper Topics section below for more details).
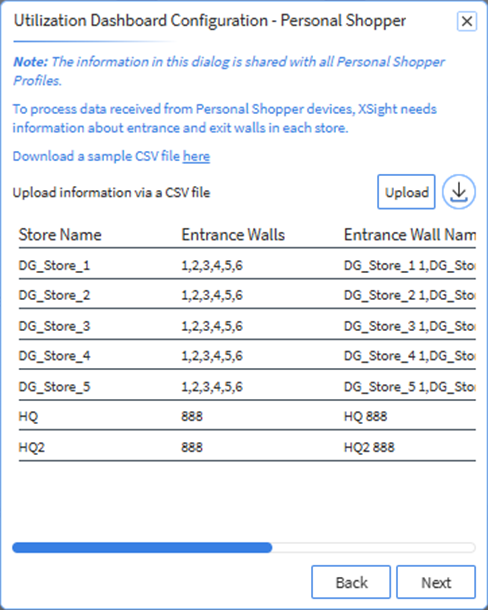
- Upload a *.csv file with information on current store
wall mappings. The *.csv file is global to all Personal
Shopper Utilization profiles. To add, edit or delete store or wall
information, re-upload the *.csv file. Note: On re-upload, data is overridden globally in all Personal Shopper profiles. Refer to the Store Wall Mappings CSV File section below for additional details.
-
Select the Custom Attribute which identifies the store that a device belongs to. The values of the Custom Attributes should match the values in the first column of the *.csv file.
For example, on the device, the configured custom attribute would be "Store =Store_001" or "Store =Store_100".Note: The custom attribute selected is global to all profiles. Devices in all profiles must be mapped to a store using the same custom attribute.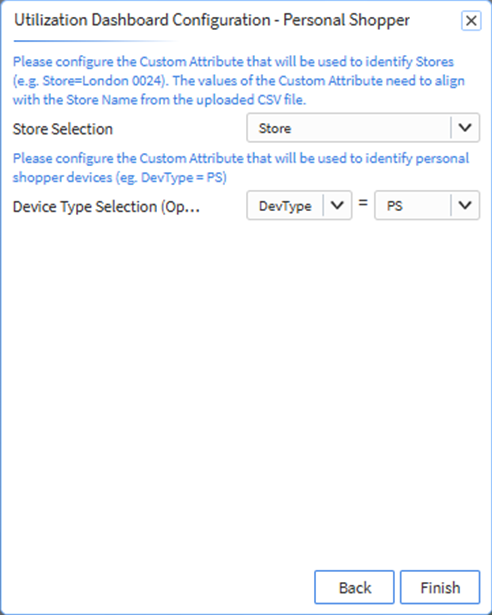
- Optionally, select an additional Custom Attribute that identifies the device
type amongst devices. For example, on the device, the configured Custom
Attribute would be "Device Type= PS" (refer to the screenshot above).Note: The custom attribute selected is global to all profiles. Devices in all profiles must map to a device type using the same custom attribute.
Personal Shopper Topics
The following topics can be selected during the Personal Shopper Profile configuration.
- Device Status: Device Status shows whether a Personal Shopper device is In Wall or Out of Wall. This is a display topic in Live View. When the displayed color is green, the device is In Wall, and if red, the device is Out of Wall.
- Wall Info: If a device is In Wall, Wall Info displays Wall Row, Wall Column and Wall ID. This is a shared topic event in Live View.
Store Wall Mappings CSV File
This file must have 5 columns.
- Store Name: The string used to identify the stores. Store Names are
mandatory and must be unique. Enter a comma separated list of Store
Names.
- Example: "Store_001, Store_002, Store_100"
Note: It is important that the same values are used to identify stores on your devices. For example, if devices are tagged with custom attribute values such as Store_001, Store_002, …, the store names in the first column should match these values. In this way, the device is accurately mapped to the store and the store is mapped to its respective Entrance and Exit walls. - Entrance Wall IDs: Enter a comma separated list of Entrance Wall IDs
for the respective store. Entrance Wall IDs are mandatory.
- Example: "001,002, 003"
- Entrance Wall Names: Enter a comma separated list of Entrance wall
Names for the respective store.
- Example: "North, South, East"
Note: If there are only Entrance Wall IDs and no Entrance Wall Names, then enter an empty list in the Entrance Wall Names column. For example, " , , " - Exit Wall IDs: Enter a comma separated list of Exit Wall IDs for the respective store. If there are no Exit walls, the column should be left empty.
- Exit Wall Names: Enter a comma separated list of Exit Wall Names for the respective store. If there are no Exit walls, the column should be left empty.
StoreName,EntranceWalls IDs,EntranceWalls Names,ExitWalls IDs,ExitWalls Names
Store_001,"1,2,3,4","North,South,East,West","888, 889","North, South"
Store_002,"10,12,17,11","Retail1,Retail2,Retail3,Retail4","900, 901","Retail5, Retail6"
Store_003,"15,19,13,12","North Entrance, South Entrance, East Entrance, West Entrance","200, 201","South Exit, West Exit"
Store_010,"23,24,25,26,27","North Entrance,South Entrance, East Entrance,West Entrance, North East Entrance","700, 725, 750","North Exit, South Exit, East Exit"
Device Utilization Dashboard
Charts
- Models–5 Most Used: This chart shows a breakdown of device models that
reported data.
- Calculation: Each segment shows the percentage of devices for the top five models used.
- Configurations: Users can choose to see 3, 5, 10 or 15 most or least used models.
- Maximum Devices in Each Wall by Hour: This chart shows the maximum number
of devices in a wall, by hour in a store.
- Calculation: Each point shows the maximum number of devices that were in the respective wall at the same time within that hour.
- Configurations: Users can select which store they would like to view. Users can also choose to view the maximum or minimum number of devices in a wall, by hour or by date.
- Maximums by Hour: This chart shows the maximum number of devices that
were Utilized, Not Utilized and Offline across all selected stores by the hour.
- Calculation: Each stacked bar represents the maximum number of devices that are Utilized, Not Utilized and Offline, at a point in time within the hour.
- Configurations: Users can choose to view the maximum or minimum number of devices that are Utilized, Not Utilized and Offline, at a point in time within the hour or date.
- Average Time in Wall: This chart represents the average time a device
remains in walls in a store.
- Calculation: Each bar represents the average time the devices are in the respective wall in the selected store.
- Configuration: Users can select which store’s walls they would like to view. Users can also choose to exclude a specific time duration for which they do not want view data.
- Average Device Utilization Time by Date: This chart shows the average
time a device is used for. This is the time between an Entrance wall and Exit
wall, or, in the case of no Exit walls, the time between an Entrance wall and
the checkout event from the third-party app.
- Calculation: Each bar represents the average time taken to return a device to an Exit wall from an Entrance wall, or for a checkout event (from the third-party store app) from an Entrance wall, by date.
- Average Device Return Time by Date: This chart shows the average time it
takes to transfer devices from an Exit wall to an Entrance wall by date.
- Calculation: Each bar represents the average time taken to return a device to an Entrance wall from an Exit wall, by date.
Device Table
The table contains the following information:
- Device Name
- Device ID
- Device Group
- Number of Utilization Sessions
- Average Session Time
- Average Entrance Time
- Average Transfer Time
- Store Name
- OS Version
- Manufacturer
- Model
Utilization by Store Dashboard Charts
- Maximum Device Utilization by Store: This chart shows the maximum
number of devices that were Utilized, Not Utilized and Offline by store.
- Calculation: Each stacked bar represents the maximum number of devices that were Utilized at a given point in time, Not Utilized and Offline at that time point in the respective store.
- Maximum Device Utilization % by Store" This chart shows the maximum
percentage of devices that were Utilized, Not Utilized and Offline by
store.
- Calculation: Each stacked bar represents the maximum percentage of devices that were Utilized at a given point in time, Not Utilized and Offline at that time point in the respective store.
- Minimum Device Utilization by Store: This chart shows the minimum
number of devices that were Utilized, Not Utilized and Offline by store.
- Calculation: Each stacked bar represents the minimum number of devices that were Utilized at a given point in time, Not Utilized and Offline at that time point in the respective store.
-
Minimum Device Utilization % by Store: This chart shows the minimum percentage of devices that were Utilized, Not Utilized and Offline by store.
- Calculation: Each stacked bar represents the minimum percentage of devices that were Utilized at a given point in time, Not Utilized and Offline at that time point in the respective store.
- Average Device Utilization Time by Store: This chart shows the
average time a device is being used by a customer, by store.
- Calculation: Each bar represents the average time taken to return a device to an Exit wall from an Entrance wall, or for a checkout event (from the third-party store app) from an Entrance wall, by store.
- Average Device Return Time by Store: This chart shows the average
time taken for devices per store to be transferred from an Exit wall to an
Entrance wall.
- Calculation: Each bar represents the average time taken for devices in the respective store to be transferred from an Exit wall to an Entrance wall, or from the checkout event (from the third-party store app) to an Entrance wall by store.
SOTI Personal Shopper Application
The Personal Shopper Utilization Dashboard receives data from the SOTI Personal Shopper Application. Download the SOTI Personal Shopper Application and push the package to all Personal Shopper devices to see data on the dashboard. You can download the SOTI Personal Shopper Application from the XSight Downloads on SOTI Pulse page.
The SOTI Personal Shopper Feature Plugin detects a utilization period for every device.
- User Utilization Time is considered as the duration of time from when a device
is unplugged from an Entrance wall and plugged back into an Exit wall or
executes the checkout event if the third-party store app integrates with the SOTI Personal Shopper Application using XTS.Note: You can download the instructions to integrate with the SOTI Personal Shopper Application from the SOTI XSight Downloads on SOTI Pulse page.
- Return Time is the duration of time from when a device is transferred between an Exit wall and an Entrance wall or from the checkout event to Entrance wall.
- Time in Wall is the duration of time that the device is plugged into an Entrance or Exit wall.