Chart Interactive Options
Using interactive operations to enhance your data visualization experience when using charts in SOTI MobiControl.
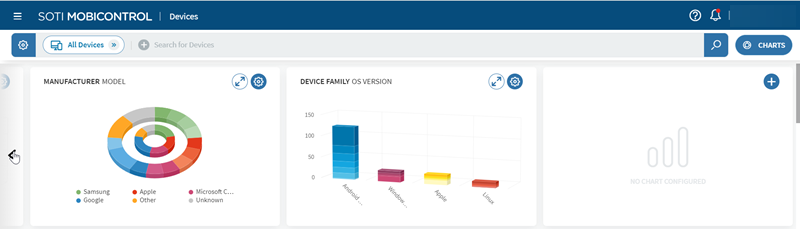
- Drag a chart to a different location to customize your layout.
- Hover over specific chart sections to reveal relevant statistics.
- Select a specific chart section to perform either of the following features:
- Selecting Other from a Column Chart or Donut Chart transforms the chart to display the Other's constituent data values.
- For all other chart selections, it automatically creates a search query based on the selected data value.
- Select from the chart's top-right corner to configure its properties if available.