Understanding Charts
Charts in SOTI MobiControl offer graphical representations of properties. The dashboard’s contents determine the information displayed in the charts.
Charts are available for the following dashboards:
- Device Dashboard
- Apps Dashboard
- Certificates Dashboard
Viewing Charts
Charts are visible by default, but you can hide the charts view entirely by toggling the Charts option. Pan through your chart view by selecting the left or right arrow icons. Magnify charts as required from the chart's top-right corner.
Toggling between 2D and 3D charts views:
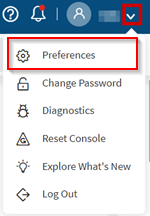
- Navigate to the top-right corner of the SOTI MobiControl console and select your username.
- In the dropdown menu, select .
- Toggle between 2D and 3D charts view per preference.

Tip: For more options on interacting with charts, see Chart Interactive Options.
Device Dashboard
When SOTI MobiControl is first installed, the default device charts
are:
- Manufacturer Model
- Last Connect Date
- Device Family (OS Version)
Add, remove, or edit these charts to display device properties that better reflect your needs.
Select new charts from a predefined list or create custom charts. Simply select the gear icon on a chart and choose a chart
type and device property.
Note: You can add up to twelve charts
to the charts view.
Apps Dashboard
The Apps dashboard comes with five predefined charts:
- Platform Type
- App Status
- Configured App Version
- Apps
- App Source
Restriction: You cannot create custom charts
in the Apps dashboard.
Certificates Dashboard
The Certificates dashboard comes with eight predefined charts:
- Certificates Expiring
- Renewals
- Expired Certificates
- Expiry Timeline
- Device Family
- Certificates per Template
- Provider
- Type