Chart Interactive Options
After you have built at least one chart, you can proceed to perform more operations to enhance your data visualization experience.
For customizing charts in general, you can perform the following:
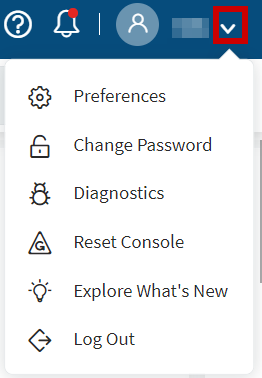
- Toggle between 2D and 3D charts: From the top right corner of the SOTI MobiControl console, select your login name to open the
dropdown menu and then select .
Select either of the following:
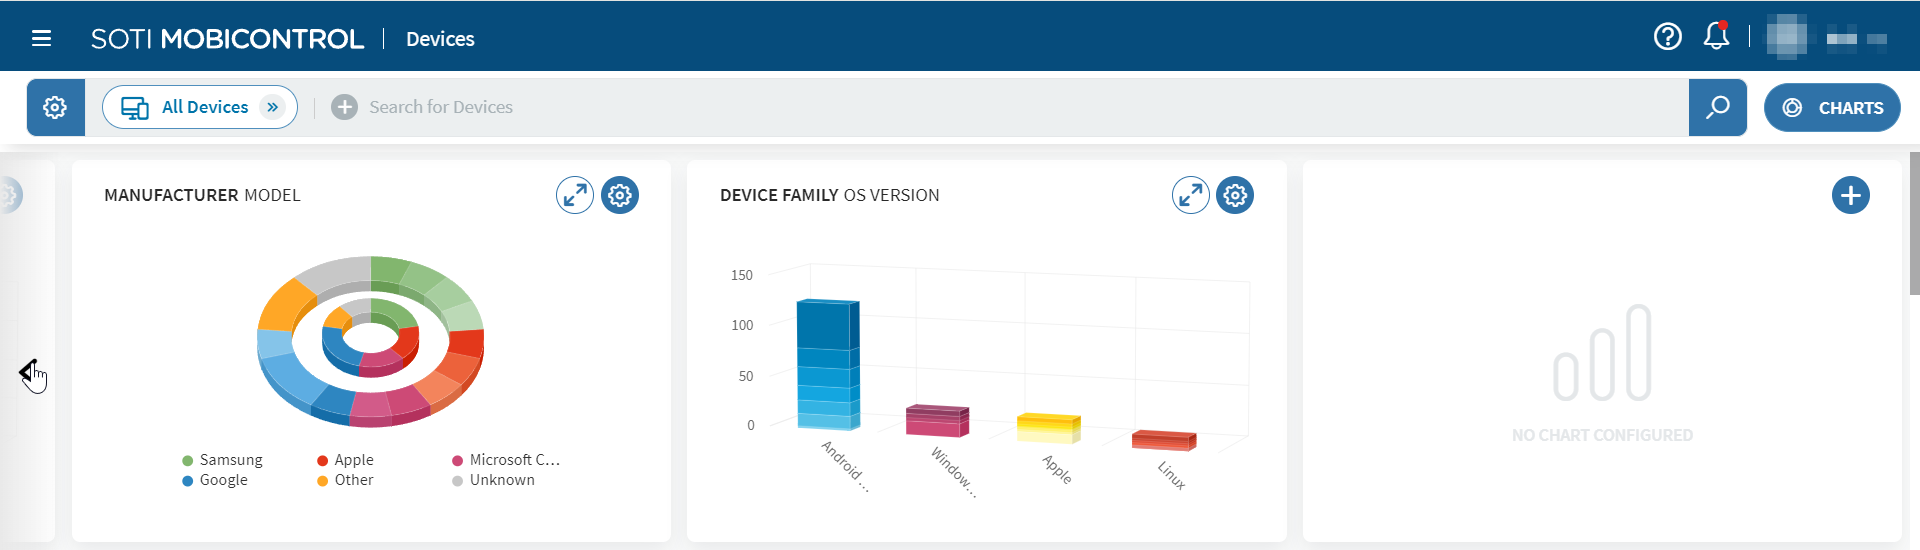
- Select the left or right arrow icon to pan the charts view.
- Select the Charts button to toggle the charts view.
For a specific chart, you can also perform any of the following customizations:
- Drag a chart to another location.
- Hover over chart sections to reveal specific statistics.
- Select a specific chart section to perform either of the following features.
- From a Column Chart or Donut Chart, if you select Other, it transforms the chart to display the Other's constituent data values.
- For all other selections of a selectable chart, it automatically creates a search query based on the selected data value.
- From the chart's top right corner, you can magnify then shrink the chart.
- From the chart's top right corner, you can configure the chart.